Iozone is a great tool to mesure performance of filesystem. You could find 10 examples here.
In it latest version, 3.97, it came with reporting tools, report.pl and gengnuplot.sh, who use gnuplot to render images.
 Due to changes in GnuPlot 4.x, report.pl and gnu3d.dem need to be updated to works. Also you may get only 8 metrics in reports instead of 15 expected in latest release of report.pl
gnu3d.dem
#
# $Id: 3D plot of performance
#
# Processes files that were created by Generate_Graphs
# and displays the results. Also, saves a postscript copy.
#
# Don Capps

set terminal x11
set title "Iozone performance"
set grid lt 2 lw 1
set surface
set parametric
set xtics
set ytics
set logscale x 2
set logscale y 2
set autoscale z
#set xrange [2.**5:2.**24]
set xlabel "File size in 2^n KBytes"
set ylabel "Record size in 2^n Kbytes"
set zlabel "Kbytes/sec"
#set data style lines
set style data lines
set dgrid3d 80,80,3
splot 'write/iozone_gen_out.gnuplot' title "Write performance"
pause -1 "Hit return to continue"
set terminal postscript color
set output "write/write.ps"
splot 'write/iozone_gen_out.gnuplot' title "Write performance"

set terminal x11
set title "Iozone performance"
set grid lt 2 lw 1
set surface
set xtics
set ytics
set logscale x 2
set logscale y 2
set autoscale z
#set xrange [2.**5:2.**24]
set xlabel "File size in 2^n KBytes"
set ylabel "Record size in 2^n Kbytes"
set zlabel "Kbytes/sec"
#set data style lines
set style data lines
set dgrid3d 80,80,3
splot 'rewrite/iozone_gen_out.gnuplot' using 1:2:3 title "ReWrite performance" with lines
pause -1 "Hit return to continue"
set terminal postscript color
set output "rewrite/rewrite.ps"
splot 'rewrite/iozone_gen_out.gnuplot' using 1:2:3 title "ReWrite performance" with lines

set terminal x11
set title "Iozone performance"
set grid lt 2 lw 1
set surface
set xtics
set ytics
set logscale x 2
set logscale y 2
set autoscale z
#set xrange [2.**5:2.**24]
set xlabel "File size in 2^n KBytes"
set ylabel "Record size in 2^n Kbytes"
set zlabel "Kbytes/sec"
#set data style lines
set style data lines
set dgrid3d 80,80,3
splot 'read/iozone_gen_out.gnuplot' using 1:2:3 title "Read performance" with lines
pause -1 "Hit return to continue"
set terminal postscript color
set output "read/read.ps"
splot 'read/iozone_gen_out.gnuplot' using 1:2:3 title "Read performance" with lines


set terminal x11
set title "Iozone performance"
set grid lt 2 lw 1
set surface
set xtics
set ytics
set logscale x 2
set logscale y 2
set autoscale z
#set xrange [2.**5:2.**24]
set xlabel "File size in 2^n KBytes"
set ylabel "Record size in 2^n Kbytes"
set zlabel "Kbytes/sec"
#set data style lines
set style data lines
set dgrid3d 80,80,3
splot 'reread/iozone_gen_out.gnuplot' using 1:2:3 title "Reread performance" with lines
pause -1 "Hit return to continue"
set terminal postscript color
set output "reread/reread.ps"
splot 'reread/iozone_gen_out.gnuplot' using 1:2:3 title "Reread performance" with lines

set terminal x11
set title "Iozone performance"
set grid lt 2 lw 1
set surface
set xtics
set ytics
set logscale x 2
set logscale y 2
set autoscale z
#set xrange [2.**5:2.**24]
set xlabel "File size in 2^n KBytes"
set ylabel "Record size in 2^n Kbytes"
set zlabel "Kbytes/sec"
#set data style lines
set style data lines
set dgrid3d 80,80,3
splot 'randread/iozone_gen_out.gnuplot' using 1:2:3 title "Random read performance" with lines
pause -1 "Hit return to continue"
set terminal postscript color
set output "randread/randread.ps"
splot 'randread/iozone_gen_out.gnuplot' using 1:2:3 title "Random read performance" with lines

set terminal x11
set title "Iozone performance"
set grid lt 2 lw 1
set surface
set xtics
set ytics
set logscale x 2
set logscale y 2
set autoscale z
#set xrange [2.**5:2.**24]
set xlabel "File size in 2^n KBytes"
set ylabel "Record size in 2^n Kbytes"
set zlabel "Kbytes/sec"
#set data style lines
set style data lines
set dgrid3d 80,80,3
splot 'randwrite/iozone_gen_out.gnuplot' using 1:2:3 title "Random write performance" with lines
pause -1 "Hit return to continue"
set terminal postscript color
set output "randwrite/randwrite.ps"
splot 'randwrite/iozone_gen_out.gnuplot' using 1:2:3 title "Random write performance" with lines

set terminal x11
set title "Iozone performance"
set grid lt 2 lw 1
set surface
set xtics
set ytics
set logscale x 2
set logscale y 2
set autoscale z
#set xrange [2.**5:2.**24]
set xlabel "File size in 2^n KBytes"
set ylabel "Record size in 2^n Kbytes"
set zlabel "Kbytes/sec"
#set data style lines
set style data lines
set dgrid3d 80,80,3
splot 'bkwdread/iozone_gen_out.gnuplot' using 1:2:3 title "Read Backwards performance" with lines
pause -1 "Hit return to continue"
set terminal postscript color
set output "bkwdread/bkwdread.ps"
splot 'bkwdread/iozone_gen_out.gnuplot' using 1:2:3 title "Read Backwards performance" with lines

set terminal x11
set title "Iozone performance"
set grid lt 2 lw 1
set surface
set xtics
set ytics
set logscale x 2
set logscale y 2
set autoscale z
#set xrange [2.**5:2.**24]
set xlabel "File size in 2^n KBytes"
set ylabel "Record size in 2^n Kbytes"
set zlabel "Kbytes/sec"
#set data style lines
set style data lines
set dgrid3d 80,80,3
splot 'recrewrite/iozone_gen_out.gnuplot' using 1:2:3 title "Record rewrite performance" with lines
pause -1 "Hit return to continue"
set terminal postscript color
set output "recrewrite/recrewrite.ps"
splot 'recrewrite/iozone_gen_out.gnuplot' using 1:2:3 title "Record rewrite performance" with lines

set terminal x11
set title "Iozone performance"
set grid lt 2 lw 1
set surface
set xtics
set ytics
set logscale x 2
set logscale y 2
set autoscale z
#set xrange [2.**5:2.**24]
set xlabel "File size in 2^n KBytes"
set ylabel "Record size in 2^n Kbytes"
set zlabel "Kbytes/sec"
#set data style lines
set style data lines
set dgrid3d 80,80,3
splot 'strideread/iozone_gen_out.gnuplot' using 1:2:3 title "Stride read performance" with lines
pause -1 "Hit return to continue"
set terminal postscript color
set output "strideread/strideread.ps"
splot 'strideread/iozone_gen_out.gnuplot' using 1:2:3 title "Stride read performance" with lines

set terminal x11
set title "Iozone performance"
set grid lt 2 lw 1
set surface
set xtics
set ytics
set logscale x 2
set logscale y 2
set autoscale z
#set xrange [2.**5:2.**24]
set xlabel "File size in 2^n KBytes"
set ylabel "Record size in 2^n Kbytes"
set zlabel "Kbytes/sec"
#set data style lines
set style data lines
set dgrid3d 80,80,3
splot 'fwrite/iozone_gen_out.gnuplot' using 1:2:3 title "Fwrite performance" with lines
pause -1 "Hit return to continue"
set terminal postscript color
set output "fwrite/fwrite.ps"
splot 'fwrite/iozone_gen_out.gnuplot' using 1:2:3 title "Fwrite performance" with lines

set terminal x11
set title "Iozone performance"
set grid lt 2 lw 1
set surface
set xtics
set ytics
set logscale x 2
set logscale y 2
set autoscale z
#set xrange [2.**5:2.**24]
set xlabel "File size in 2^n KBytes"
set ylabel "Record size in 2^n Kbytes"
set zlabel "Kbytes/sec"
#set data style lines
set style data lines
set dgrid3d 80,80,3
splot 'frewrite/iozone_gen_out.gnuplot' using 1:2:3 title "Frewrite performance" with lines
pause -1 "Hit return to continue"
set terminal postscript color
set output "frewrite/frewrite.ps"
splot 'frewrite/iozone_gen_out.gnuplot' using 1:2:3 title "Frewrite performance" with lines

set terminal x11
set title "Iozone performance"
set grid lt 2 lw 1
set surface
set xtics
set ytics
set logscale x 2
set logscale y 2
set autoscale z
#set xrange [2.**5:2.**24]
set xlabel "File size in 2^n KBytes"
set ylabel "Record size in 2^n Kbytes"
set zlabel "Kbytes/sec"
#set data style lines
set style data lines
set dgrid3d 80,80,3
splot 'fread/iozone_gen_out.gnuplot' using 1:2:3 title "Fread performance" with lines
pause -1 "Hit return to continue"
set terminal postscript color
set output "fread/fread.ps"
splot 'fread/iozone_gen_out.gnuplot' using 1:2:3 title "Fread performance" with lines

set terminal x11
set title "Iozone performance"
set grid lt 2 lw 1
set surface
set xtics
set ytics
set logscale x 2
set logscale y 2
set autoscale z
#set xrange [2.**5:2.**24]
set xlabel "File size in 2^n KBytes"
set ylabel "Record size in 2^n Kbytes"
set zlabel "Kbytes/sec"
#set data style lines
set style data lines
set dgrid3d 80,80,3
splot 'freread/iozone_gen_out.gnuplot' using 1:2:3 title "Freread performance" with lines
pause -1 "Hit return to exit"
set terminal postscript color
set output "freread/freread.ps"
splot 'freread/iozone_gen_out.gnuplot' using 1:2:3 title "Freread performance" with lines
report.pl
#!/usr/bin/perl
#
# arguments: one of more report files
#
# Christian Mautner <christian * mautner . ca>, 2005-10-31
#
# This script is based loosely on the Generate_Graph set
# of scripts that come with iozone, but is a complete re-write
#
# The main reason to write this was the need to compare the behaviour of
# two or more different setups, for tuning filesystems or
# comparing different pieces of hardware.
#
# This script is in the public domain, too short and too trivial
# to deserve a copyright.
#
# Simply run iozone like, for example, ./iozone -a -g 4G > config1.out (if your machine has 4GB)
# and then run perl report.pl config1.out
# or get another report from another box into config2.out and run
# perl report.pl config1.out config2.out
# the look in the report_* directory for .png
#
# If you don't like png or the graphic size, search for "set terminal" in this file and put whatever gnuplot
# terminal you want. Note I've also noticed that gnuplot switched the set terminal png syntax
# a while back, you might need "set terminal png small size 900,700"
#
@Reports=@ARGV;
die "usage: $0 <iozone.out> [<iozone2.out>...]\n" if not @Reports or grep (m|^-|, @Reports);
die "report files must be in current directory" if grep (m|/|, @Reports);
%columns=(
'write' =>3,
'read' =>5,
'rewrite' =>4,
'reread' =>6,
'randread' =>7,
'randwrite' =>8,
'bkwdread' =>9,
'recrewrite'=>10,
'strideread'=>11,
'fwrite' =>12,
'frewrite' =>13,
'fread' =>14,
'freread' =>15,
);
#
# create output directory. the name is the concatenation
# of all report file names (minus the file extension, plus
# prefix report_)
#
$outdir="report_".join("_",map{/([^\.]+)(\..*)?/ && $1}(@Reports));
print STDERR "Output directory: $outdir ";
if ( -d $outdir )
{
print STDERR "(removing old directory) ";
system "rm -rf $outdir";
}
mkdir $outdir or die "cannot make directory $outdir";
print STDERR "done.\nPreparing data files...";
foreach $report (@Reports)
{
open(I, $report) or die "cannot open $report for reading";
$report=~/^([^\.]+)/;
$datafile="$1.dat";
push @datafiles, $datafile;
open(O, ">$outdir/$datafile") or die "cannot open $outdir/$datafile for writing";
open(O2, ">$outdir/2d-$datafile") or die "cannot open $outdir/$datafile for writing";
while(<I>)
{
next unless ( /^[\s\d]+$/ );
@split = split();
# We may have only 7 metrics (no block entries). Replaced == 15 with >=8
next unless ( @split >= 8 );
print O;
print O2 if $split[1] == 16384 or $split[0] == $split[1];
}
close I, O, O2;
}
print STDERR "done.\nGenerating graphs:";
foreach $column (keys %columns)
{
print STDERR " $column";
open(G, ">$outdir/$column.do") or die "cannot open $outdir/$column.do for writing";
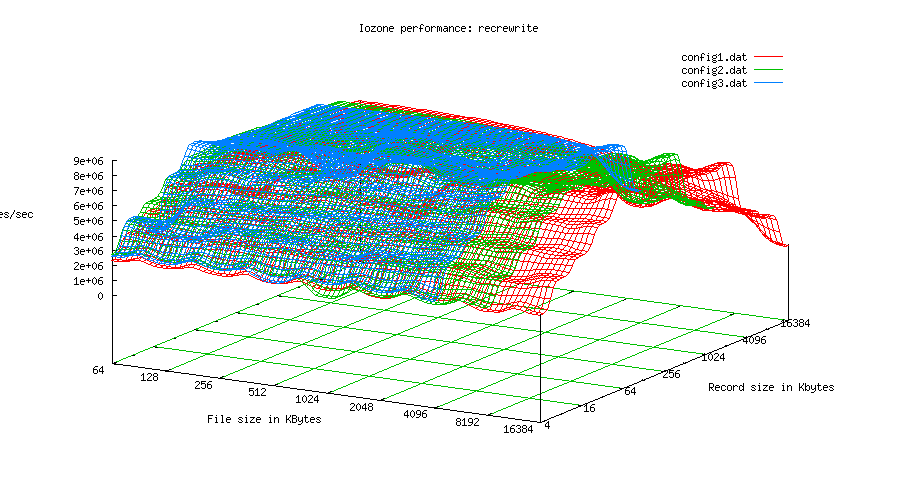
print G qq{
set title "Iozone performance: $column"
set grid lt 2 lw 1
set surface
set parametric
set xtics
set ytics
set logscale x 2
set logscale y 2
set autoscale z
#set xrange [2.**5:2.**24]
set xlabel "File size in KBytes"
set ylabel "Record size in Kbytes"
set zlabel "Kbytes/sec"
#set data style lines
set style data lines
set dgrid3d 80,80,3
#set terminal png small picsize 900 700
set terminal png small size 900 700
set output "$column.png"
};
print G "splot ". join(", ", map{qq{"$_" using 1:2:$columns{$column} title "$_"}}(@datafiles));
print G "\n";
close G;
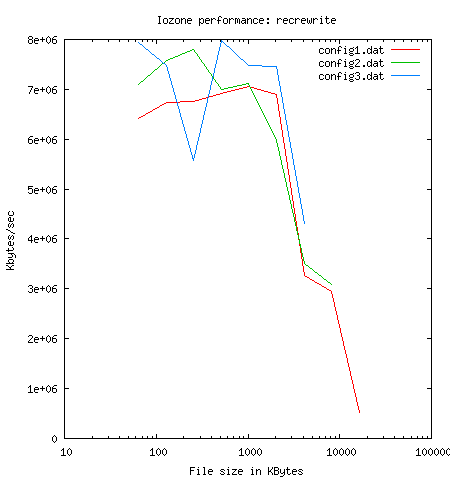
open(G, ">$outdir/2d-$column.do") or die "cannot open $outdir/$column.do for writing";
print G qq{
set title "Iozone performance: $column"
#set terminal png small picsize 450 350
set terminal png small size 450 350
set logscale x
set xlabel "File size in KBytes"
set ylabel "Kbytes/sec"
set output "2d-$column.png"
};
print G "plot ". join(", ", map{qq{"2d-$_" using 1:$columns{$column} title "$_" with lines}}(@datafiles));
print G "\n";
close G;
if ( system("cd $outdir && gnuplot $column.do && gnuplot 2d-$column.do") )
{
print STDERR "(failed) ";
}
else
{
print STDERR "(ok) ";
}
}
print STDERR "done.\n";